Statistical functions of EZR
For discrete
variables
Frequency distributions/cr Confidence interval for a
proportion
One sample proportion test
Confidence interval for a difference
between two proportions
Confidence interval for a ratio of two
proportions
Compare two proportions (Fisher's exact test and Chi-square
test)
Compare proportions of two paired samples (McNemar test)
Compare
proportions of more than two paired samples (Cochran Q test)
Cochran-Armitage
test for trend in proportions
Logistic regression
Ordinal logistic regression
Multinomial logistic regression
For continuous
variables
Numerical summaries
Smirnov-Grubbs test for
outliers
Kolmogorov-Smirnov test for normal distribution
Confidence
interval for a mean
Single-sample t-test
Two-variances
F-test
Two-sample t-test
Paired t-test
Bartlett's test
One-way
ANOVA
Repeated-measures ANOVA
Multi-way ANOVA
ANCOVA
Test for
Pearson's correlation
Linear regression
Linear mixed model
For nonparametric tests
for continuous variables
Mann-Whitney U test
Wilcoxon's signed
rank test
Kruskal-Wallis test
Friedman test
Jonckheere-Terpstra
test
Spearman's rank correlation test
For survival
analysis
Kaplan-Meier survival curve and logrank test
Logrank
trend test
Cox proportional hazard regression
Cox proportional hazard
regression with time-dependent covariate
Cumulative incidence of competing
events and Gray test
Fine-Gray proportional hazard regression for competing
events
Fine-Gray proportional hazard regression with time-dependent covariate
For diagnostic test analysis
Accuracy of
qualitative test
Kappa statistics for agreement of two tests
Compute
positive and negative predictive values
ROC curve analysis for quantitative
test
Compare two ROC curves
ROC curve analysis for time-to-event data
Cronbach's alpha coefficient for reliability
For matched-pair analysis
Extract matched controls (This function relys on optmatch package and is
limietd to academic use.)
Mantel-Haenzel test for matched proportions
Conditional logistic
regression for matched-pair analysis
Stratified Cox proportional hazard
regression for matched-pair analysis
For meta-analysis and
meta-regression test
Meta-analysis and meta-regression test for
proportions
Meta-analysis and meta-regression test for means
Meta-analysis
and meta-regression test for hazard ratios
Network meta-analysis
For smaple size and power
calculation
Calculate sample size from control and desired response
rates
Calculate sample size from proportion and confidence
interval
Calculate sample size or power for comparison with specified
proportion
Calculate sample size or power for comparison between two
proportions
Calculate sample size for non-inferiority trial of two
proportions
Calculate sample size for selection design in randomized phase 2 trial
Calculate sample size from standard deviation and confidence interval
Calculate sample size or power for comparison between two
means
Calculate sample size or power for comparison between two paired
means
Calculate sample size or power for comparison between two survival
curves
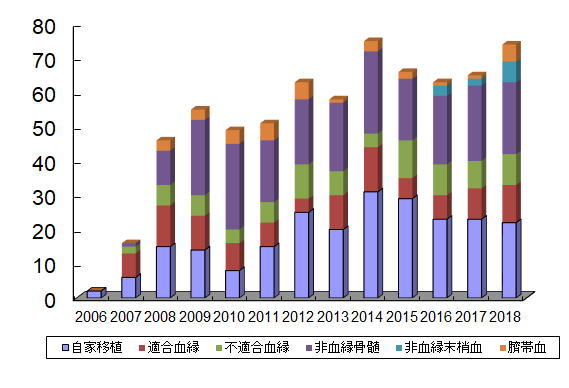
For drawing graphs
Bar graph(Frequencies)
Pie
chart(Frequencies)
Stem-and-leaf display
Histogram
QQ plot
Bar
graph(Means)
Line graph(Means)
Line graph(Repeated
measures)
Boxplot
Dot chart
Ordered chart
Swimmer plot
Sankey diagram
CONSORT diagram
Scatterplot
Scatterplot
matrix
Adjusted survival curve
Adjusted cumulative incidence curve
Stacked cumulative incidences
Statistical functions from original R
commander
Principal-components analysis
Factor
analysis
k-means cluster analysis
Hierarchical cluster
analysis
Summarize hierarchical clustering
Add hierarchical clustering to
data set
Linear hypothesis
Variance-inflation factor
Breusch-Pagan test
for heteroscedasticity
Durbin-Watson test for autocorrelation
RESET test
for nonlinearity
Bonferroni outlier test
Basic diagnostic
plots
Residual quantile-comparison plot
Component+residual
plots
Added-variable plots
Influence plot
Effect plots
Click to view large images.
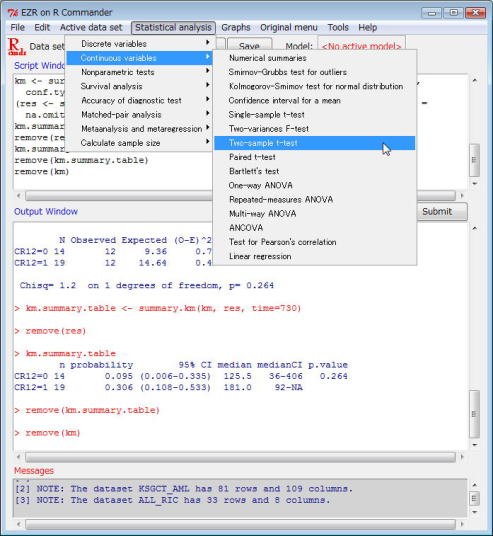 EZR menu |
 Summary of analysis |
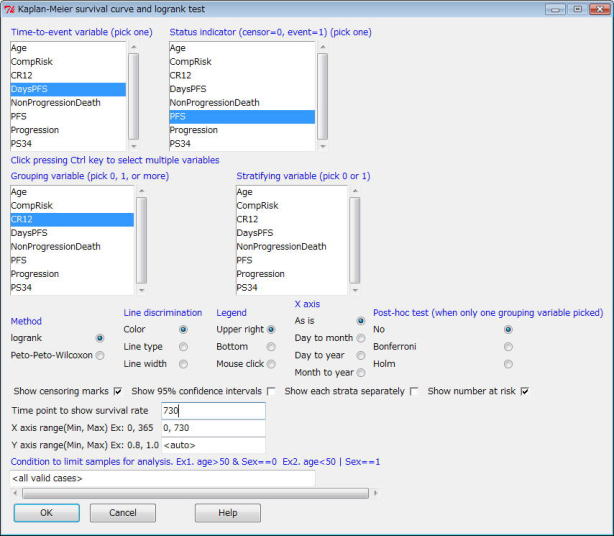 Survival analysis |
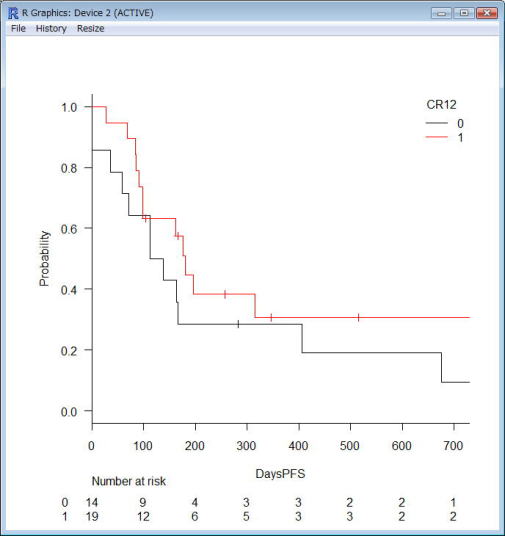 Kaplan-Meier plot |
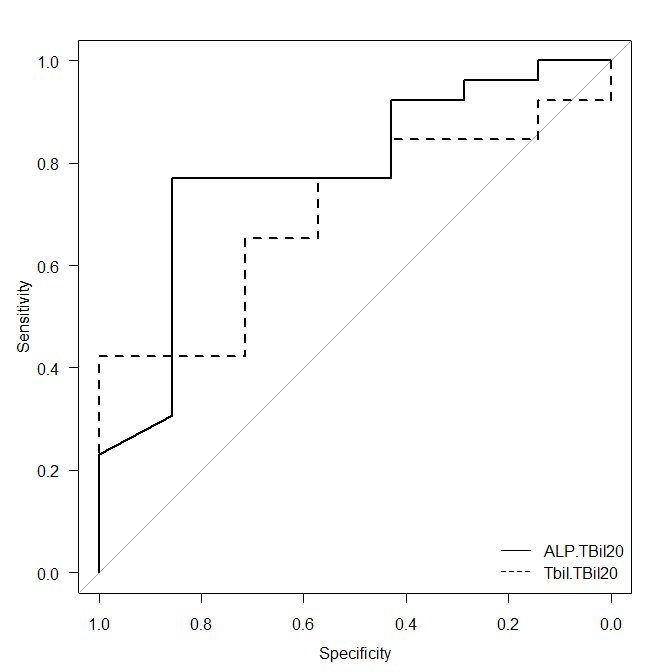 ROC analysis |
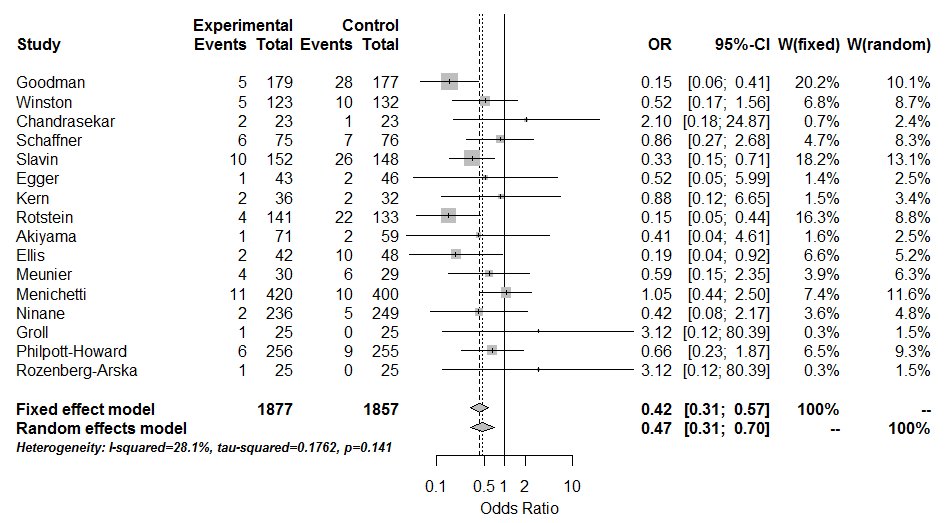 Metaanalyis |