Basic operations in EZR
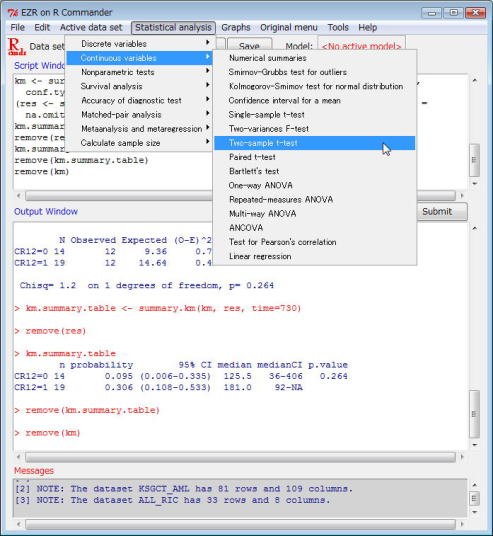
EZR functions can be started by point-and-click access using the items on the menu bar. R commander automatically creates and executes corresponding R commands that appear in the "Script window". Results are shown in the "Output window". If any errors or warnings are noted, messages will appear in the "Message window". The created commands can be saved by selecting "File" > "Save script" on the menu bar. The output can be saved by selecting "File" > "Save output". By saving the commands, users can reproduce the analyses and can also share the procedure with the other investigators.
The following EZR functions can be executed by typing the commands in the "Script window" and clicking on the "Submit” button".
Following functions are built to create a formatted table for presentation.
w.twoway(table, filename) function copies the results of two-way table analyses to the clipboard or text file.
w.ttest(table, filename) function copies the results of t-test to the clipboard or text file.
w.survival(table, filename) function copies the results of survival analyses to the clipboard or text file.
w.ci(table, filename) function copies the results of cumulative incidence analyses to the clipboard or text file.
w.multi(table, filename) function copies the results of multivariate regression analyses to the clipboard or text file.
"table" can be omitted except for logistic regression analysis and Fine & Gray proportinal hazard regression analysis, in which "odds" and "crr.table" should be specified for "table"(default is "cox.table" to copy the results of Cox proportional hazard regression analysis).
If "filename" is omitted, the formatted table will be copied to the clopboard, which can be pasted into a spreadsheet.
Mantel.Byar() functon is for Mantel-Byar test, which should be performed after executing "Cox proportional hazard modeling with time-dependent covariate".
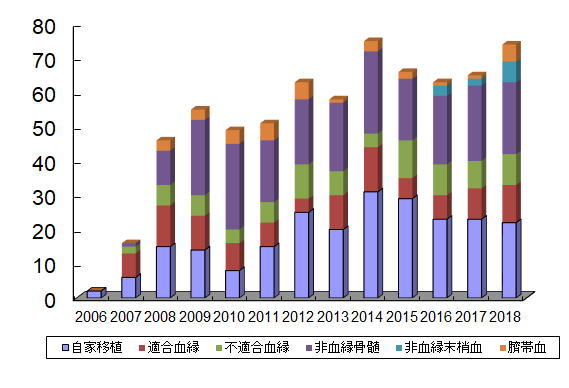
Waterfall plot for treatment response can be created by "Ordered chart". For example, if variables A and B indicate the tumor sizes before and after treatments, respectively, a variable C that indicates treatment response can be created by a equation of (B/A)*100-100 by using the "Create new variables" menu. Waterfall plot will be shown using the "Orderd chart" by specifying "Plot type" and "Order" as "Box" and "Decreasing", respectively.
Click to view large images.
 EZR menu |
 Summary of analysis |
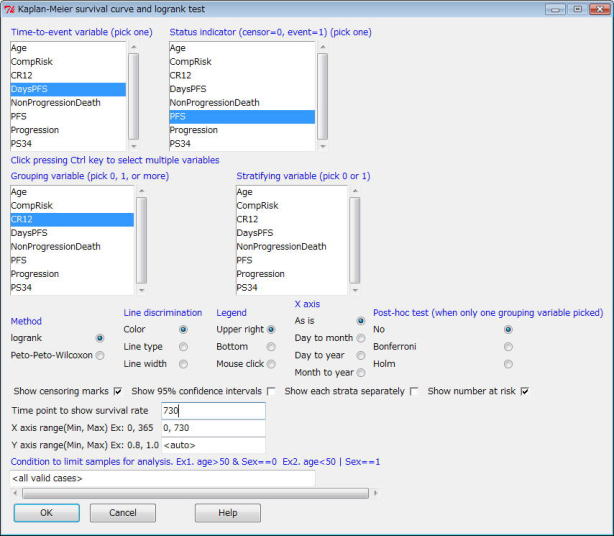 Survival analysis |
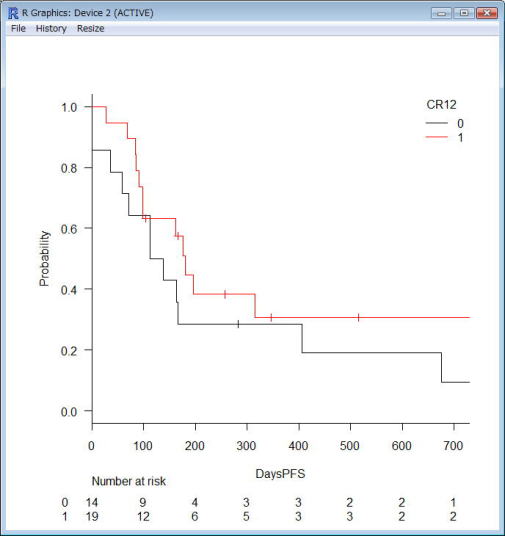 Kaplan-Meier plot |
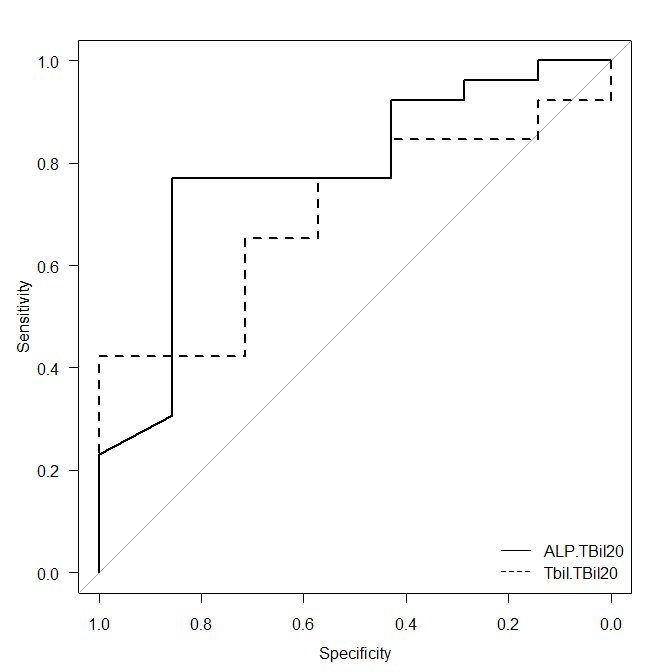 ROC analysis |
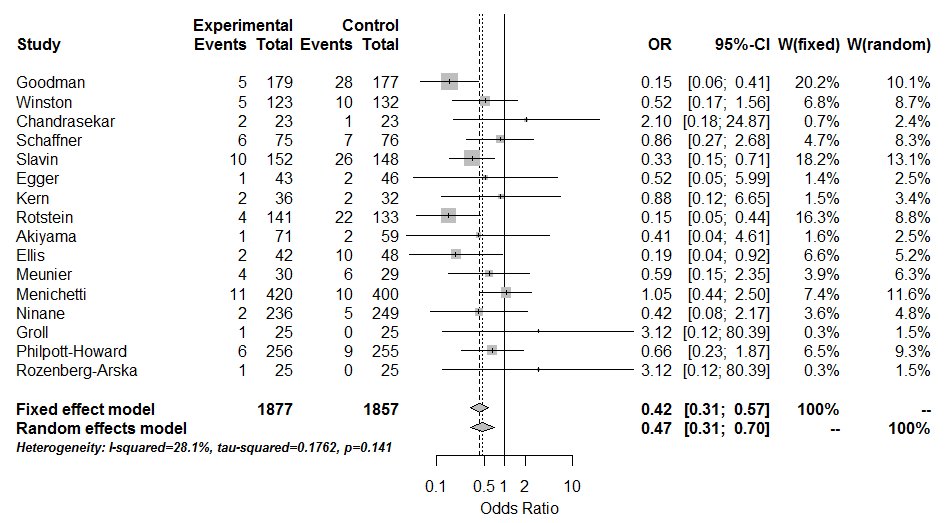 Metaanalyis |